Read the Chart.
Time the Trade.
Course 204 teaches you to read and interpret stock charts and key technical indicators — so you can optimize your Buy and Sell order execution and enhance returns on your long-term value investments.

Use Technical Analysis to Invest Smarter
Value Investing tells you what to buy. Technical Analysis tells you when to buy it. Course 204 bridges that gap — teaching you to read price charts and interpret key technical indicators to optimize the timing and execution of your buy and sell orders.
This is not a day trading course. It is a practical tool for long-term value investors who want to enter and exit positions at better prices, spot market trends, and understand price performance in context — without abandoning the fundamentals-first approach that defines great investing.
In one focused lesson, you will gain the technical literacy to complement your Value Investing research and analysis with smarter, more informed trade execution.


Charts That Tell You When to Act
Technical Analysis is the discipline of reading market price and volume data to identify patterns, trends, and momentum — giving you the edge to execute your Value Investing decisions at the right moment.
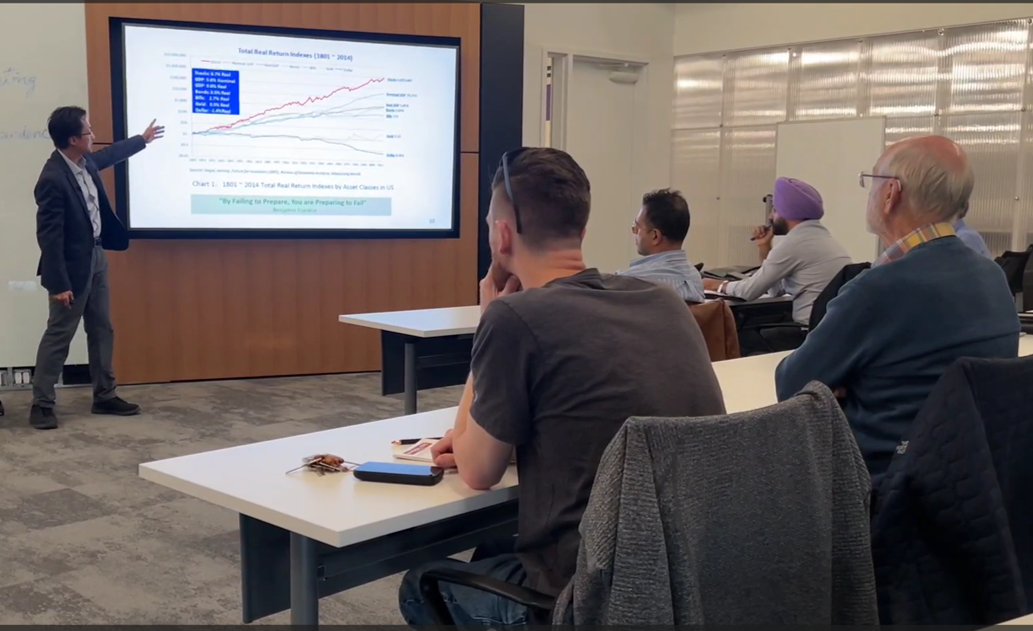
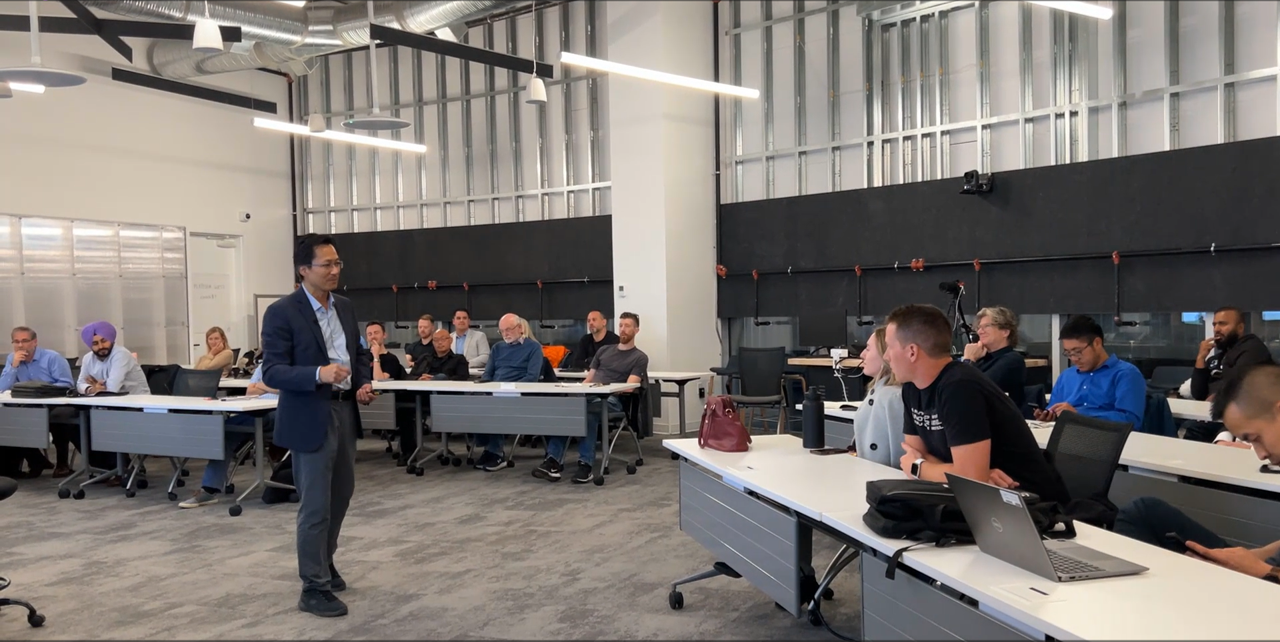
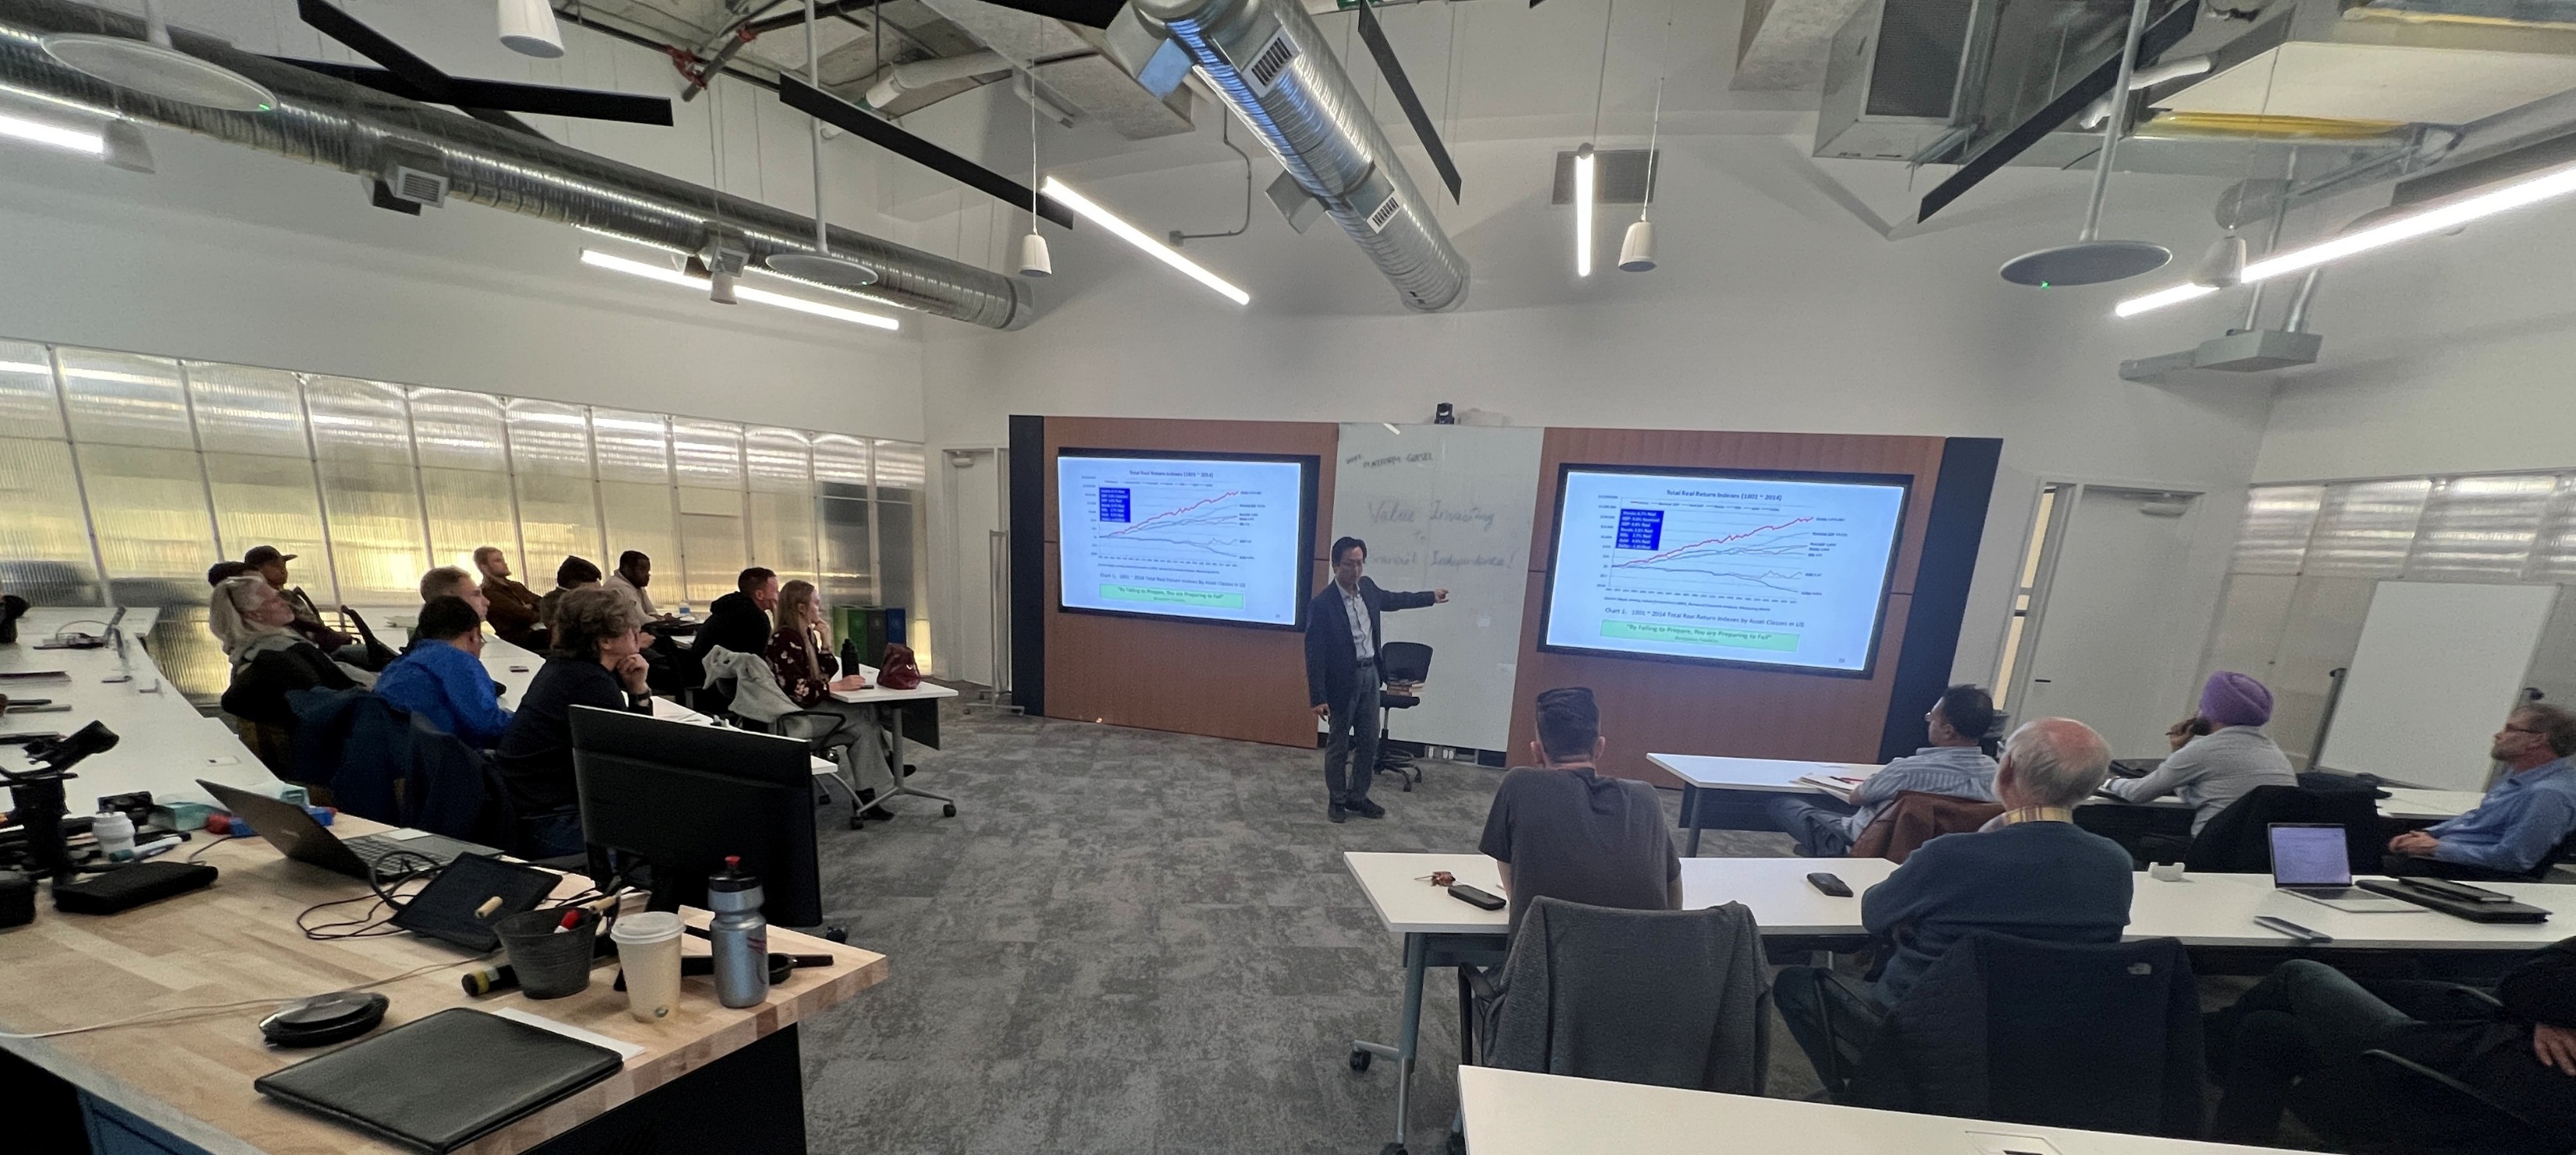
One Lesson. Complete Technical Foundation.
A single, comprehensive video lesson covering everything a value investor needs to know about technical analysis — from chart reading to indicator interpretation to trade execution.
The Indicators Every Investor Must Know
This course focuses on the basic and key technical indicators that are most relevant and useful for long-term value investors — cutting through complexity to what actually matters.
Technical Skills That Sharpen Every Trade
At the end of Course 204 you will have a practical, investor-relevant understanding of technical analysis that directly improves how you execute your value investing strategy.
For Every Investor Who Wants to Execute Better
You Know What to Buy
You're working through the 201 Mastery program and understand Value Investing fundamentals. Now you want to sharpen your trade execution — knowing not just what to buy, but exactly when to pull the trigger.
You Want Better Entry Points
You already identify great companies using fundamental analysis. Technical Analysis gives you the additional toolkit to time your entries and exits more precisely — improving your average cost and overall returns.
Charts Have Always Confused You
You've opened a stock chart before but weren't sure what you were looking at. This lesson demystifies charts and indicators entirely — teaching you to read them clearly and confidently in plain language.
You Think in Years, Not Days
This is not a day trading course. It's built for long-term investors who want to use technical signals as one additional tool to make smarter, better-timed decisions on their long-term value investing positions.

Dennis Wongman
Dennis Wong — "The Wongman" — is the Founder & CIO of Bowmont Capital and Bowmont Wealth Academy. In Course 204, Dennis teaches Technical Analysis not as a standalone discipline, but as a practical complement to Value Investing — helping you use charts and indicators to execute your fundamentals-driven decisions with greater precision.
His investor-first approach ensures that Technical Analysis is always in service of your long-term wealth-building strategy — never a distraction from it.
- Registered Professional Engineer
- Management Executive with a Fortune Most Valuable Company
- Technology Start-Up Entrepreneur
- Public Equity and Real Estate Investor
- Founder & CIO — Bowmont Capital & Bowmont Wealth Academy
Real People. Real Results.
Hear from students who went through Bowmont Wealth Academy programs and transformed their approach to investing.
"As a business owner, investing always felt like a different world. Dennis' program gave me the clarity, structure, and confidence to move from observer to active, disciplined investor. Today, I invest with independence and conviction."

"As an engineer, I value logic and risk management. Dennis' program gave me a disciplined framework grounded in fundamentals — protecting capital first and compounding intelligently. His risk-averse mindset reflects Buffett's margin-of-safety philosophy."

"I had traded stocks for years and believed I knew how to make money. But Dennis showed me the difference between trading and true investing. His calm, structured approach brought clarity to everything."

Start Reading the Charts Today.
One comprehensive lesson. The complete technical analysis toolkit for long-term value investors. Better execution starts here.
- 1 comprehensive lesson on stock charts and technical indicators
- Candlestick charts and price action interpretation
- Key indicators: Moving Averages, RSI, MACD, Volume
- Support and resistance level identification
- Optimized Buy/Sell order execution strategies
- Practical approach tailored for value investors
- Self-paced — watch on your own schedule
- Directly complements the 201 Mastery curriculum
Access is activated immediately upon enrollment. Contact us via email with any questions about Course 204 or the full 200-level suite.
Frequently Asked
No. Course 204 is specifically designed for long-term value investors — not day traders or speculators. Technical Analysis is taught as a tool to optimize the timing and execution of long-term investment decisions, not to facilitate short-term trading strategies.
Course 204 is a standalone lesson that can be taken independently. However, it is designed to complement the 201 Value Investing Mastery program — applying technical analysis as an additional layer on top of the fundamental research and valuation skills taught in 201. The two work best together.
Course 204 consists of one comprehensive video lesson covering stock charts, key technical indicators, and trade execution. The lesson is self-paced — watch it at your own speed and replay any section as many times as you need.
No prior experience with charts or technical indicators is required. This lesson starts from the basics and builds your understanding progressively — covering candlestick charts, moving averages, RSI, MACD, volume, and support and resistance in an accessible, investor-focused way.
The technical analysis skills taught in this course can be applied on any major charting or trading platform — including those covered in the 201 Mastery program's broker setup module. The indicators and tools discussed are available on all standard platforms used by retail investors.